news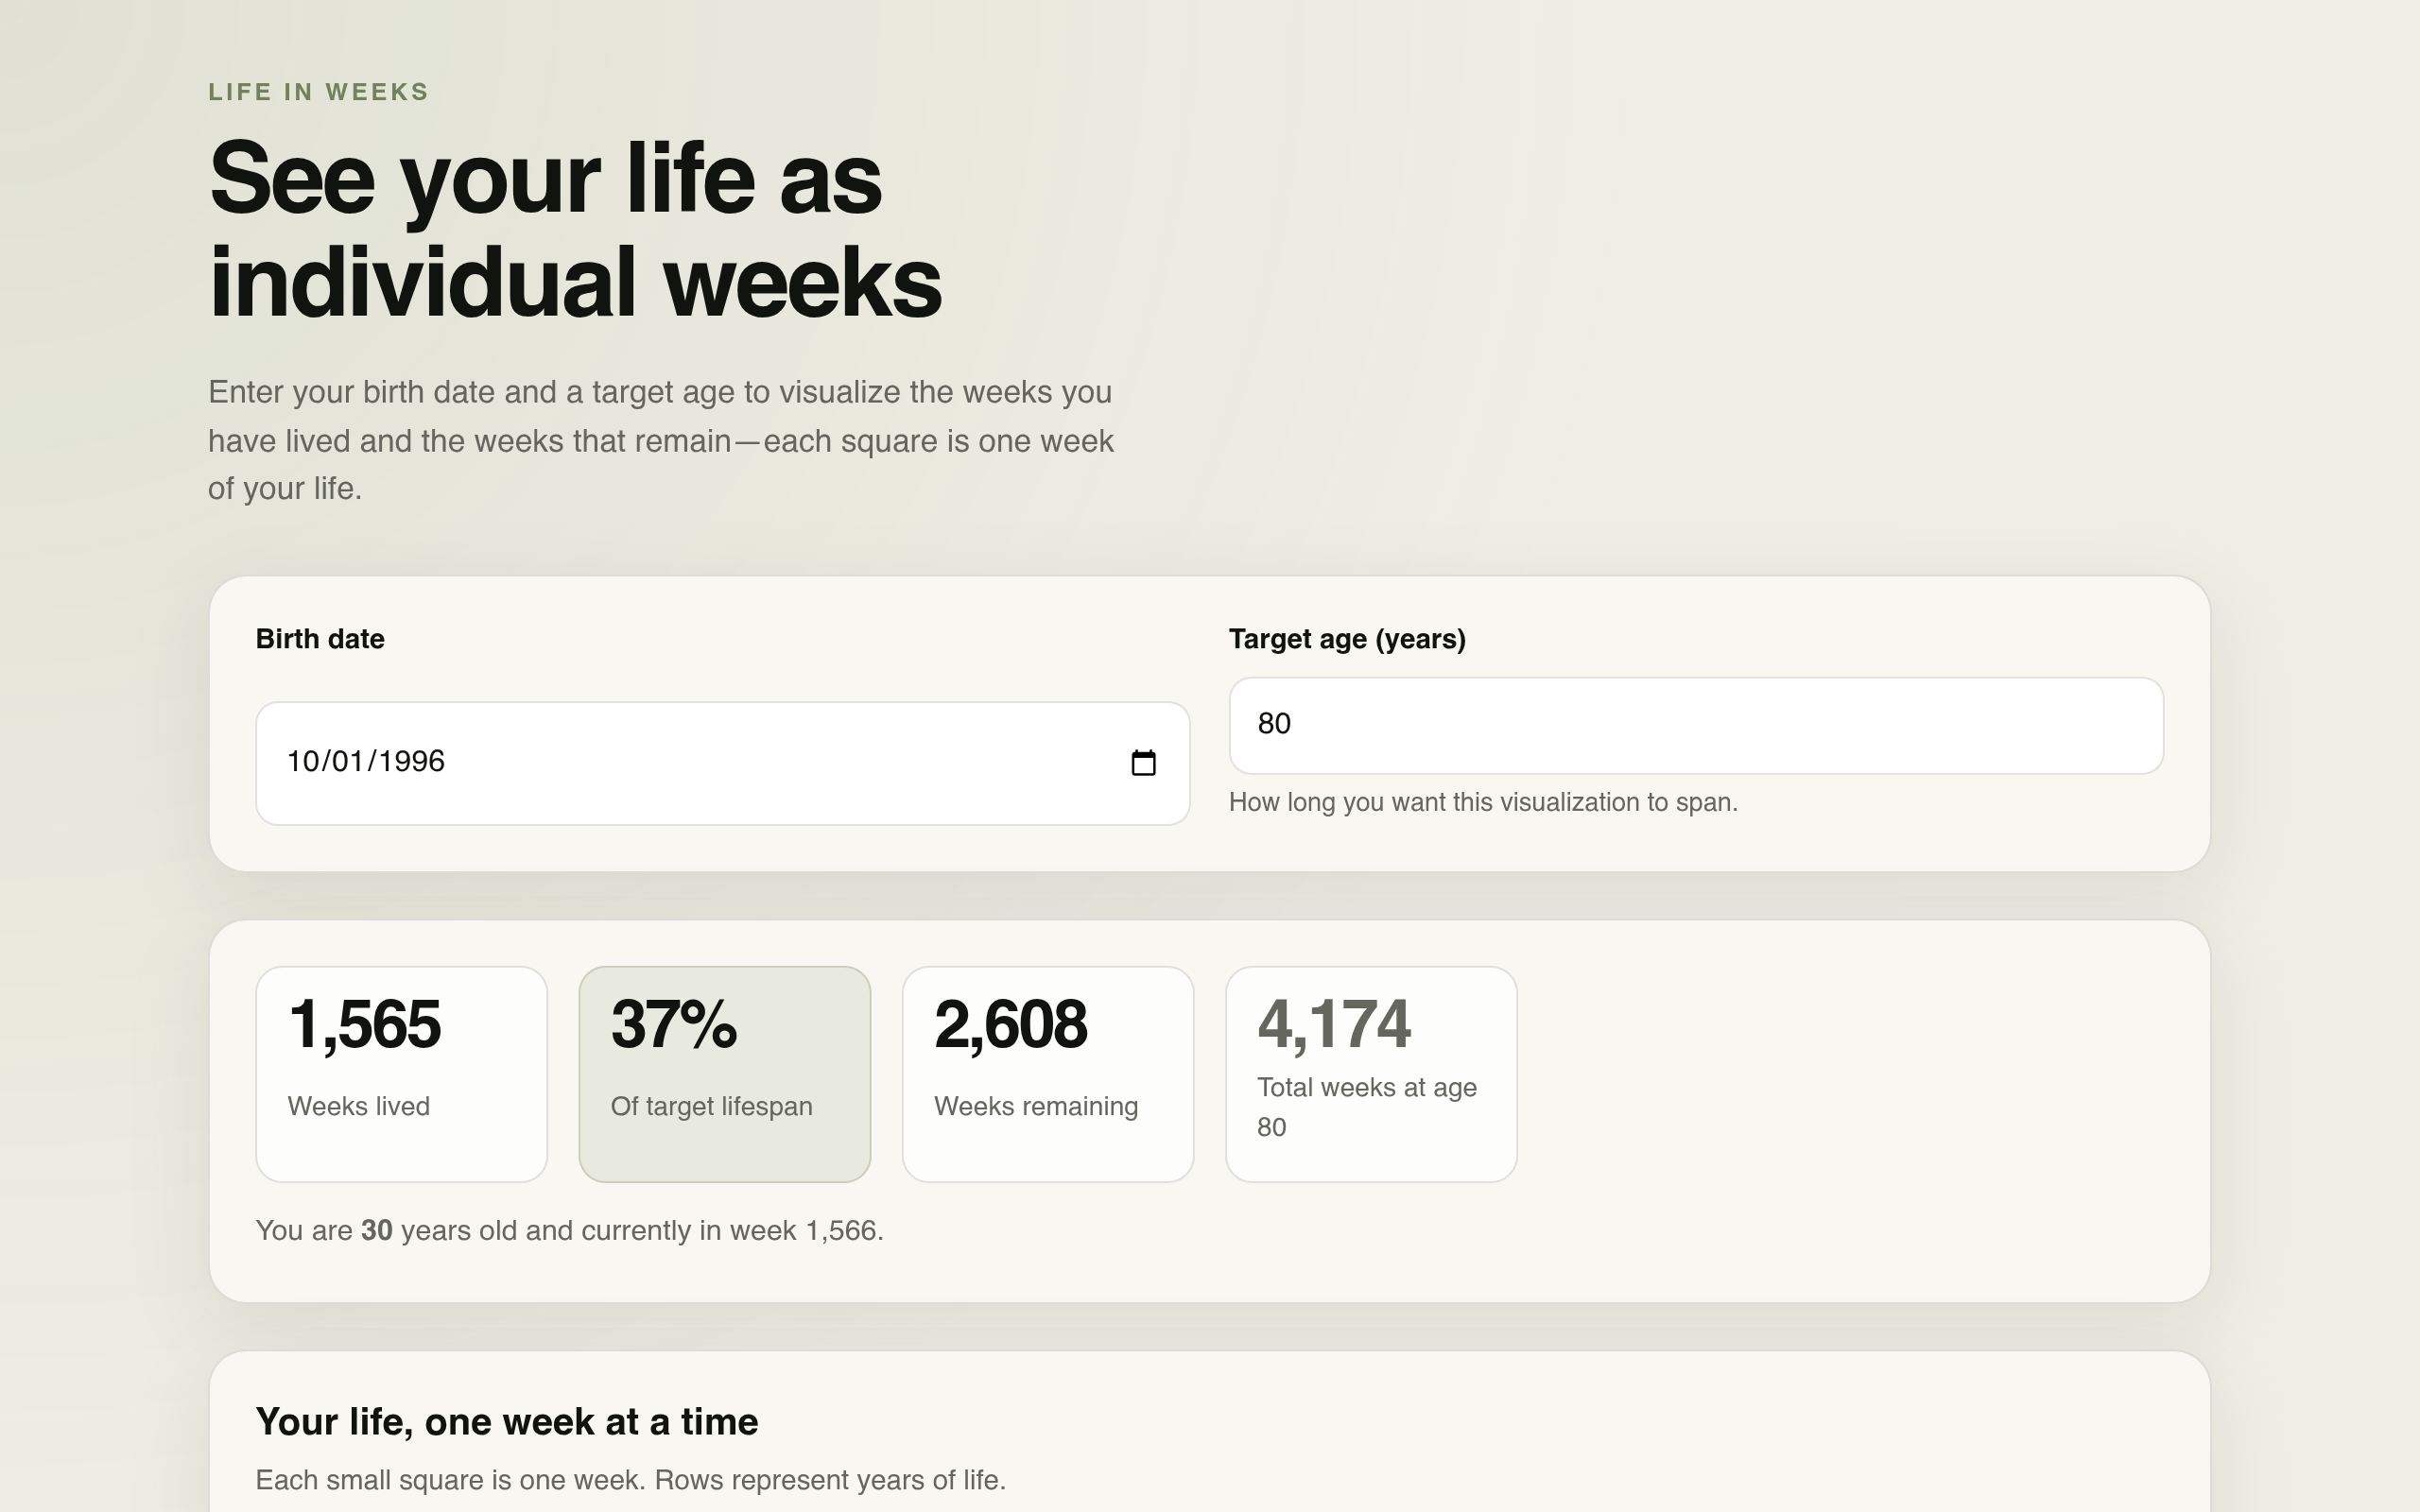
launch
Life in Weeks Visualizer is live
SAshipped by Samuel Amidini AningoreLife in Weeks Visualizer turns your lifespan into a grid of individual weeks.
Enter your birth date and a target age to see how many weeks you’ve already lived, how many remain, and what percentage of that chosen lifespan has passed. Each row is one year (52 weeks). Past weeks are filled in, the current week is highlighted, and future weeks are shown as empty squares. A clear disclaimer explains that this is only a visualization based on the target age you choose—not a prediction of how long you will live. Built as a simple, fast React app with no backend or login required. Helps people reflect on time and perspective in a tangible, visual way.
Built with React, Node.js, Vercel.